|
Visible Analyst OO Edition |
Visible Analyst OO Edition is focused on object-oriented analysis and
design, allowing the creation of class, state, use-case, sequence,
collaboration, and activity models. Notations supported include UML 2.x and OMT.
Key Features of Visible Analyst OO Edition
- Multi-user concurrent access enables team collaboration.
- Object Browser - Allows easy navigation and manipulation of all entities, attributes and relationships in the repository.
- Web publish models (reports and diagrams) for sharing across the Internet with standard HTML and JPEG formats.
- Automatically create class models based on meta-data information.
- UML 2.x and OMT support.
Class Diagrams
Overview
Class diagrams allow you to express the object model of your project
diagrammatically. You can describe the classes in the data you are modeling and the relationships between them by drawing them onto a diagram. Each diagram or view can show an arbitrarily large or small part of your object model. You can show multiple views of your object model by including different combinations of classes and relationships on various diagrams. However, the entire object model is retained in the repository.
Notational Elements
Class - The primary graphic used when creating an object model. When a class is added to a diagram, an entry is created in the repository so that additional information can be specified regarding the class, in order to complete its definition. Each class can be associated with other classes through the use of relationship lines. Each class symbol can have a subtype classification assigned when modifying the definition in the repository that is used to provide additional information about how a class is to be used.
- Standard class (the default) indicates normal class.
- Elemental indicates the class contains no attributes and physical
characteristics should be defined. (A data element and a class with an element subtype are equivalent except that methods cannot be specified for a data element.)
- Structure indicates a C style structure should be used instead of a class. Members (or attributes) of a structure are public by default while members of a class are private. Union indicates a C style union should be used instead of a class.
- Entity, Associative, and Attributive indicate the class is persistent and can be used on an entity relationship diagram.
Relationship Lines - Relationships can be labeled in one or both directions. You set this value when you create the project. Relationship lines between classes usually have terminators on each end that show if the relationship cardinality is 0:1, 1:1, 0:many, 1:many or many:many. Different types of relationships can be specified on class diagrams, including inheritance and aggregation relationships. Role names and qualifiers can also be specified.
Linkage
A class is connected to a state-transition or activity diagram.
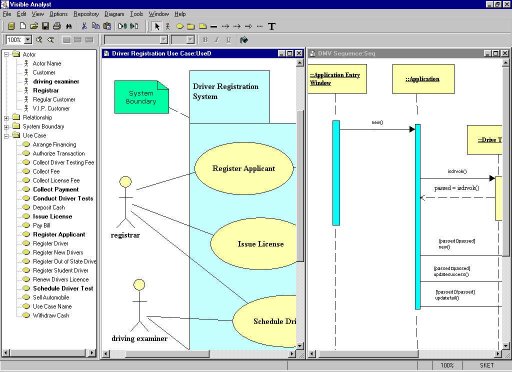
Use Case Diagrams
Overview
A use case diagram shows the relationship between a user and a computer system. A use-case captures some user-visible function.
Notational Elements
Use case - Represented by an ellipse where the name appears at the top.
Actor - Represented by a "stick man" figure. The name of the actor appears below the object.
Communicates - Relationship line between actors and use cases. Drawn as a solid line with no arrowhead. Cardinality can be shown.
Extends - Relationship line between two use cases represented by a dashed line with a stick arrowhead at one end. The name of the relationship is <<extend>>.
Includes - Relationship line between two use cases represented by a dashed line with a stick arrowhead at one end. The name of the relationship is <<include>>.
Generalization - Relationship line between two use cases or two actors
represented by a solid line with an open arrowhead at one end. Similar to generalization relationship on class diagrams.
System Boundary (Package) - Box with a tab (folder) drawn around use case symbols to indicate a complete system. The name of the system appears on the tab along with a stereotype name, unless it does not contain any objects, in which case the name is drawn inside the main part of the box. System Boundary symbols can be related using both generalization and non-generalization relationships.
Linkage
A use case is connected to a sequence, collaboration, or activity diagram. A System Boundary can be connected to another use case diagram.
Sequence Diagrams
Overview
A sequence diagram is a type of iteration diagram that describes how objects collaborate in some behavior. It is drawn in a grid-like fashion where the vertical axis represents time while the horizontal axis represents the participating objects.
Notational Elements
Object - Represented by a box where the name is in the form
ObjectName:ClassName. A dashed line, known as a lifeline, extends from the bottom of the object to the bottom of the sequence diagram.
Message - A line connecting two object lifelines. A message must correspond to a method in the called class. (If the method does not exist, the user should be prompted to create one.) A message has the following pieces of information:
- Sequence Number - Can be an integer (1, 2) or a decimal (1.1,
1.1.2).
- Iteration Marker - Boolean to indicate the message is sent multiple times.
- Guard Condition - Text describing under what condition the message is sent.
- Message Type - Synchronous (solid line with filled arrowhead),
flat/asynchronous (solid line with stick arrowhead), asynchronous (solid line with half stick arrowhead), return (dashed line with stick arowhead), or self-delegation.
- Parameters - Parameter values passed to method.
Activation - Represented as a thin rectangle along the object lifeline to
show when an object is active.
Deletion - A large X at the end of an object lifeline to indicate when an
object is destroyed.
Linkage
A sequence diagram is connected to a use-case.
Collaboration Diagrams
Overview
A collaboration diagram is a second form of iteration diagram. A
collaboration diagram shows an interaction organized around the objects in the interaction and their links to each other. Unlike a sequence diagram, a collaboration diagram shows the relationships among the object roles. On the other hand, a collaboration diagram does not show time as a separate dimension, so the sequence of messages and the concurrent threads must be determined using sequence numbers.
Notational Elements
Object - Represented by a box where the name is in the form
ObjectName:ClassName. An active object is drawn bold.
Object Link - Represented by a solid line between two objects.
Message - Represented by a line associated with an object link. A message must correspond to a method in the called class. See Sequence diagram section for details.
Linkage
A collaboration diagram is connected to a use-case.
Activity Diagrams
Overview
An activity diagram is a special form of a state diagram in which the states represent the performance of actions or sub-activities and the transitions are triggered by the completion of the actions or sub-activities. It represents a state machine of a procedure itself.
Notational Elements
Action State - Represented by a rectangle with rounded corners.
Decision - Represented by a diamond with one incoming transition and two or more outgoing transitions.
Synchronization Bar - Represented by a black bar with one or more input transitions and one or more output transitions. Used to signal parallel activities.
Start - Represented by a filled circle, used to indicate the starting point
for the activity.
End - Represented by a filled circle inside a hollow circle, used to
indicate the end point for the activity.
Swimlane - Represented by a box containing action states, swimlanes are used to organize responsibilities for actions. The name appears at the top of the box.
Transition - Represented by a solid line with a stick arrowhead. It is
labeled by a transition string of the form 'event signature [ guard
condition ] / action expression'. All components of the transition string
are optional.
Linkage
An action state can be connected to another activity diagram. The action state is then marked to indicate that it is a sub-activity state. (A similar notational convention exists in Metrica to indicate process nesting.)
An activity diagram is connected to a use-case, class, or method.
State Transition Diagrams
Overview
State transition diagrams (STDs) allow you to express the dynamic model of your project diagrammatically. You can describe the states in the data you are modeling and the events between them by drawing them onto a diagram. Each state transition diagram that you create should show the dynamic behavior of a single class. You can connect a class to a state transition diagram through the use of the Nest facility. Once connected, every state belongs to the class; and in the repository, the class name prefixes the state name. The Analyze function can assist you in determining any syntax or definition problems with your dynamic model.
Notational Elements
State - The state symbol is the primary graphic used when creating a dynamic model. When a state is added to a diagram, an entry is created in the repository so that additional information can be specified regarding the state in order to complete its definition. If the diagram has been connected to a class through the use of the Nest facility, each state on the connected diagram belongs to the exploded class, and the state name is prefixed by the class name. To represent a transition from one state to another, an event line can be drawn between states.
Events - Events are lines drawn between states to indicate a transition. They are given a name to describe the type of action that occurs to trigger the state change. Events are global objects that are not tied to a specific class. This means the same event can be used on different state transition diagrams. Event lines between states usually have a terminator on one end to indicate the direction of the transition. For example, the event Enter Password would cause a state change from Request Password to Verify Account.
Linkage
A state transition diagram is connected to a class.
Optional Elements
A note can be added to any UML diagram. It is drawn as a rectangle with a bent corner. It can be attached to methodology symbols via a dashed line with no arrowhead.
Enterprise Modeling
Visible Analyst OO Edition supports enterprise modeling by linking together projects in a parent-child relationship. The Enterprise project is used to warehouse all information pertaining to an organization, while the satellite project contains only a subset of the enterprise project allowing users to work with components that are important to their development rather than details of the entire enterprise. This capability also allows a distributed repository for geographically distributed teams. Individual software development projects can be merged into a single strategic meta-data repository that provides concurrent access of the meta-data objects by multiple developers. Visible Analyst models may be shared throughout an organization and can be synchronized dynamically with satellite projects. This provides structure for improved communications between end-users,
management and developers.
Repository, Networking, and Reporting Features
The Visible Analyst OO Edition Repository functions interactively with the diagramming and rules to automatically create an organized database of project information for each project as it is developed. The Repository is automatically updated and maintained during all of your work sessions and it can be accessed at any time to manually add, delete, edit or review entries. Version control is supported through the Enabler Repository option. The multi-user functionality permits concurrent access, simultaneous update, and file / record locking.
Visible Analyst OO Edition supports a variety of comprehensive repository reports based on the current project repository and other project information. Custom Repository reporting capabilities are also supported. Visible Analyst OO Edition supports report preview, print to file, or printer. Visible Analyst supports web publishing of reports and diagrams for sharing across the Internet in standard HTML and JPEG formats. |