Visible Systems Corporation also provides additional Educational Solutions and Distance Learning Program videos. Selected sample videos of these courses are listed in the left sidebar. Click on a link listed in the sidebar to view a short demonstration video of the material contained in the full length video. If you have questions about the courses, or if you wish to purchase a course, contact us at 617-902-0767 or send an e-mail to eLearning@visiblesystemscorp.com
![]() View the Visible Analyst Documentation here
View the Visible Analyst Documentation here
General Usage
- eTutorial Brief: How to get started with the Visible Analyst Student Edition
- eTutorial Brief: How to switch between Projects in the Visible Analyst Student Edition
- eTutorial Brief: How to resolve the "Project does not exist" Message
- eTutorial Brief: How to add users and specify their security level in the Visible Analyst
- eTutorial Brief: How to assign users to projects and specify their project access rights
Creating Diagrams
- eTutorial Brief: How to work with Functional Decomposition Diagrams
- eTutorial Brief: How to work with Data Flow Diagrams
- eTutorial Brief: How to work with Visible Analyst Business Rule Planning Statements
- eTutorial Brief: How to work with the Visible Analyst Business Process Management (BPMN) Models
- eTutorial Brief: How to work with Visible Analyst Deployment Object Models
- eTutorial Brief: How to work with Visible Analyst Component Object Models
- eTutorial Brief: How to work with Visible Analyst State Transition Models
- eeTutorial Brief: How to work with the Visible Analyst Data-to-Class Object Model Transition
Techniques
- eTutorial Brief: How to Implement the Visible Analyst Repository Integration
- eTutorial Brief: How to work with the Visible Analyst Model Management Capability
- eTutorial Brief: How to work with Data Stores
- eTutorial Brief: How to split Data Flows
- eTutorial Brief: How to work with Lines in the Visible Analyst
Instructor Edition
University Edition
- eTutorial Brief: How to use the Visible Analyst University Edition Assignment Feature
- eTutorial Brief: How to work with Functional Decomposition Diagrams
Troubleshooting Your Student Edition
PRODUCT SERIALIZATION ERROR
The Product Serialization Error message is usually generated because of the users’ inadequate rights assignments on the PC.
- 1. If users generate a “Product Serialization Error” message when starting the Visible Analyst, make sure that the users rights to the Btrieve key have been assigned on that PC. Start Regedit and navigate to HKEY_LOCAL_MACHINE\SOFTWARE\Wow6432Node\Btrieve Technologies. Right-click and select Permissions. Make sure all users have either Write or Full Control permissions.
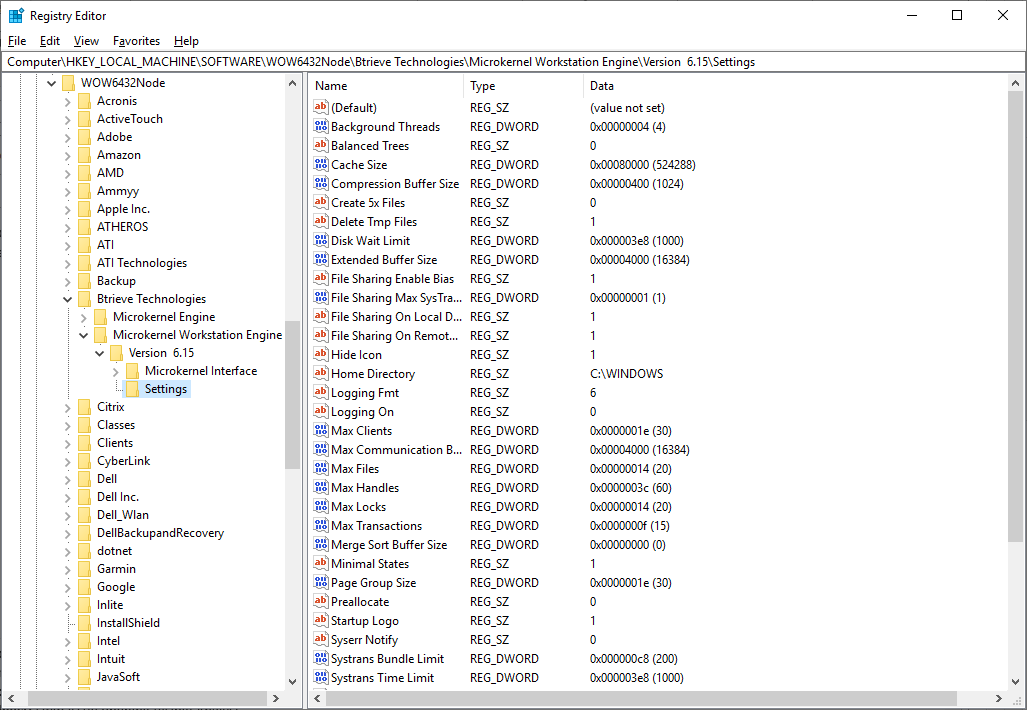
- 2. In some cases this error is generated because the temporary files written by the Btrieve database engine used by the Visible Analyst are written locally on the PC, and the user hasn’t been granted Read, Write and Modify access to the specific folder. Check the “Home Directory” and the “Trace File” key settings in HKEY_LOCAL_MACHINE\SOFTWARE\Wow6432Node\Btrieve Technologies\Microkernel Workstation Engine\Version 6.15\Settings as shown in the picture below. The users must have Read, Modify, and Write access to the specified folder where these files are written. If necessary, change the keys to a folder on the PC that the users can be assigned these rights.
Availble Films |
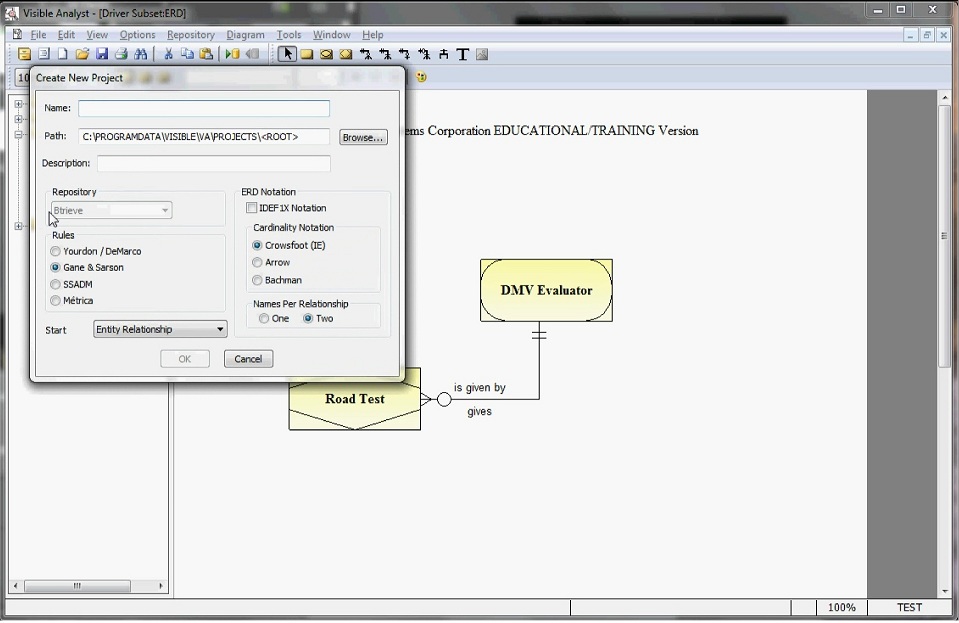 |
eTutorial Brief: How to get started with the Visible Analyst Student Edition8:56 MinutesThis video provides an overview of the common actions users perform in the Visible Analyst: How to select a project, open a diagram, create a new diagram, create a new project, acccess the tutorial file. |
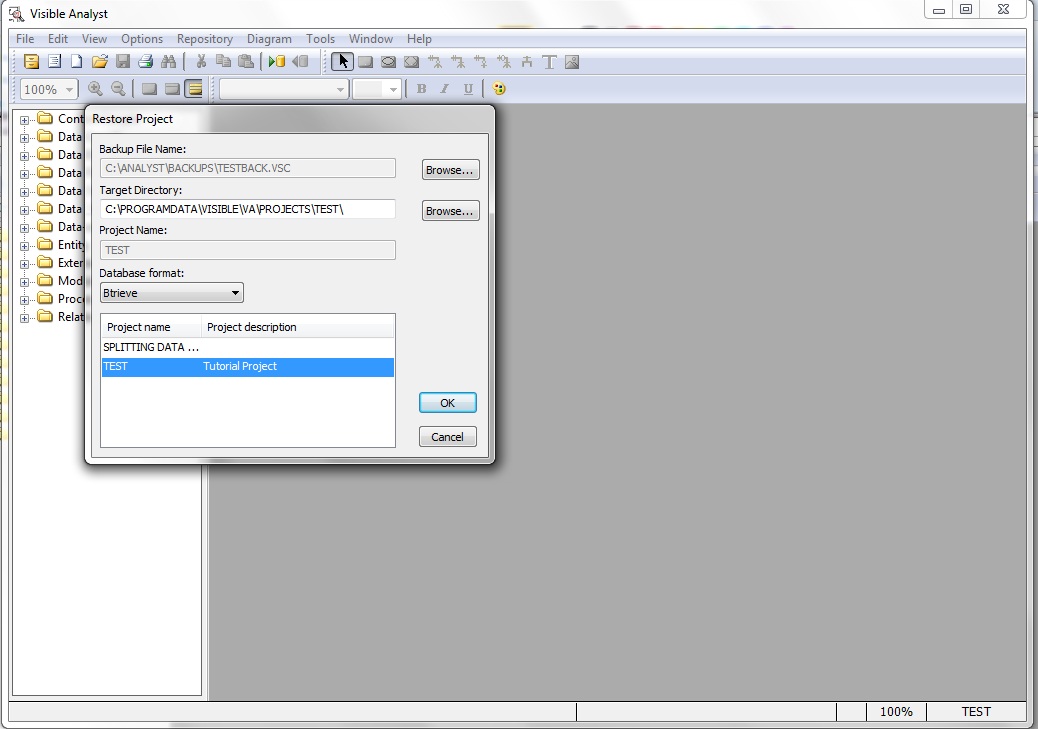 |
eTutorial Brief: How to switch between Projects in the Visible Analyst Student Edition3:39 MinutesThis video demonstrates the use of the Backup, Delete Project and Restore procedures to switch between projects in the Visible Analyst Student Edition. |
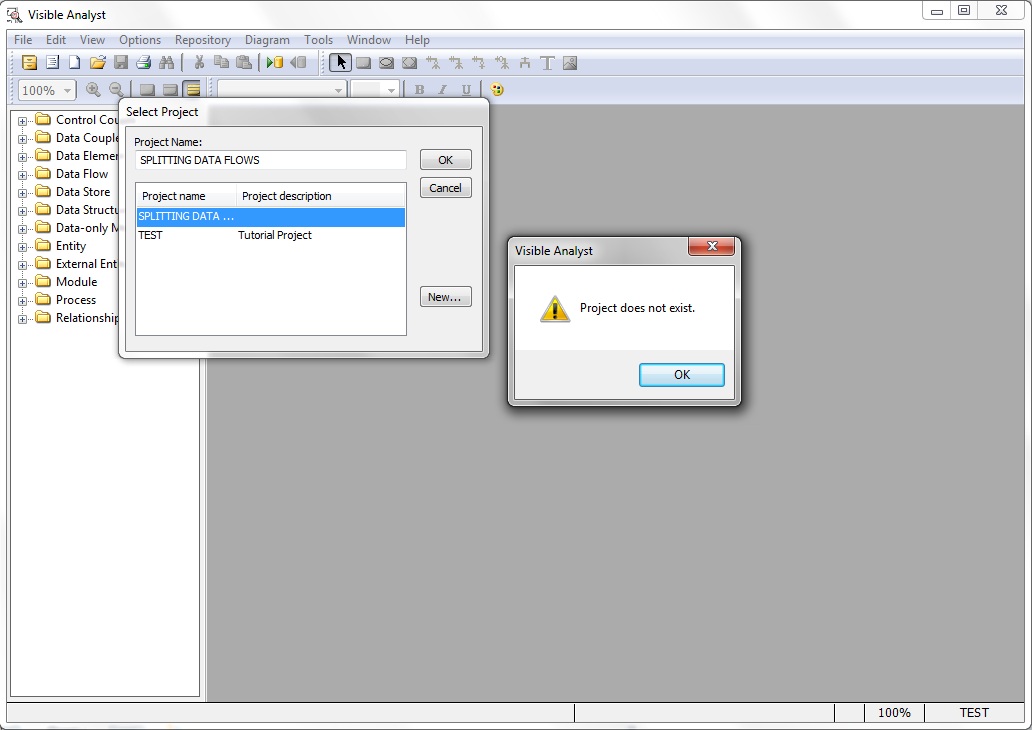 |
eTutorial Brief: How to resolve the "Project does not exist" Message2:00 MinutesExplanation how to resolve the "Project does not exist" error message when selecting a project in the Visible Analyst. |
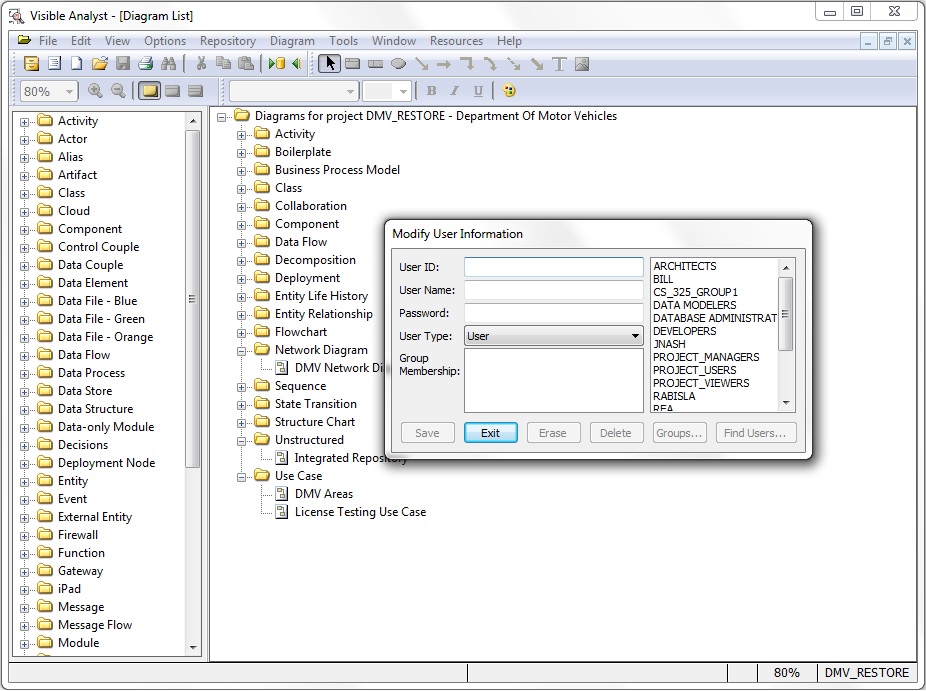 |
eTutorial Brief: Adding User Accounts in the Visible Analyst2:00 MinutesExplanation of how to to add user/group/team ID's in the Visible Analyst and assign them a security level. Assigning a password to the user/group/team ID's is optional. |
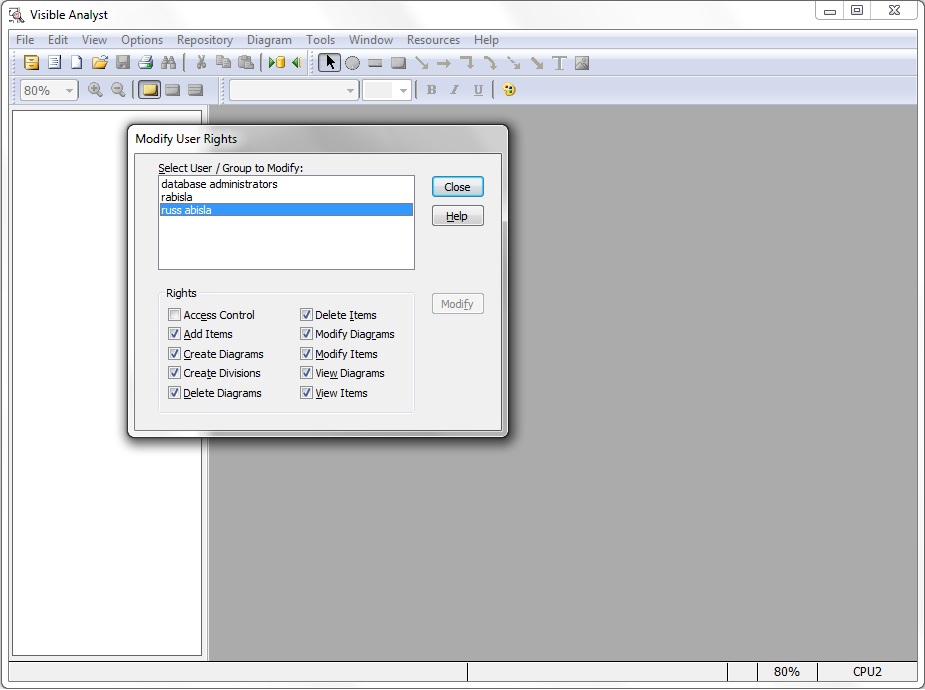 |
eTutorial Brief: How to assign users/groups/teams to a project and specify their project access rights.2:00 MinutesExplanation how to assign user/group/team ID's to a Visible Analyst project. Once assigned access to a project, the rights to edit the project diagrams and repository entries can be restricted. |
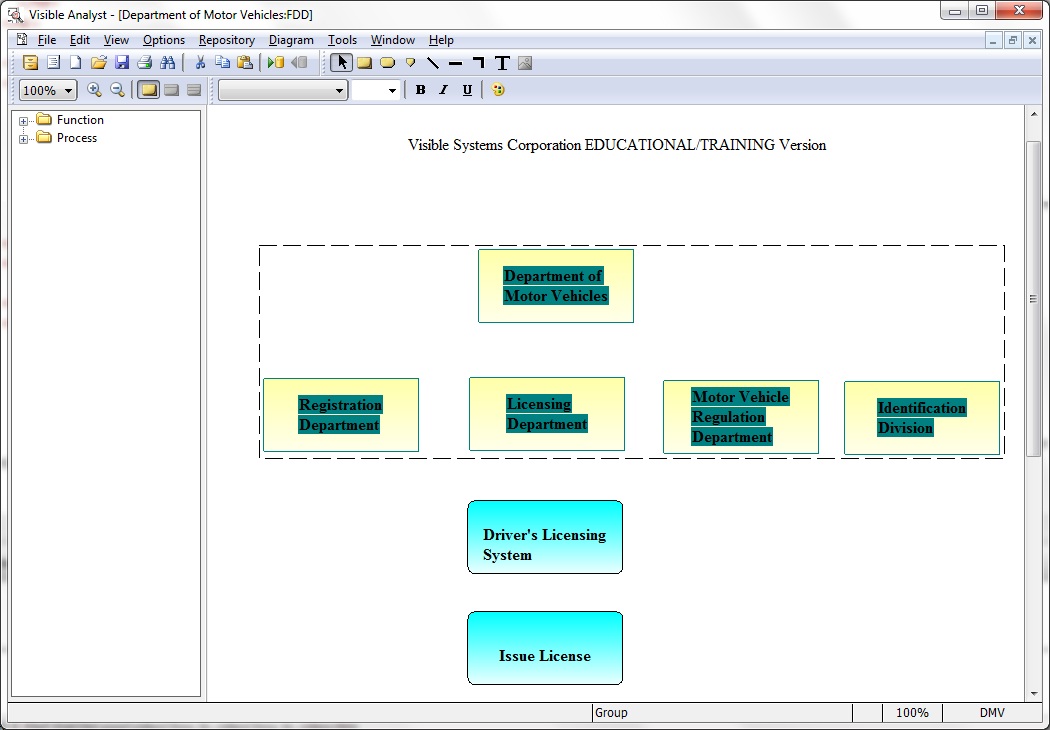 |
eTutorial Brief: How to work with Functional Decomposition Diagrams5:35 MinutesAn overview of Functional Decomposition Diagrams in the Visible Analyst. The videos demonstrates the use of Change Item, Coloring Symbols, Snap Symbols, Auto-connect to connect symbols, Analyze, and using Spawn to generate a Data Flow Diagram set. |
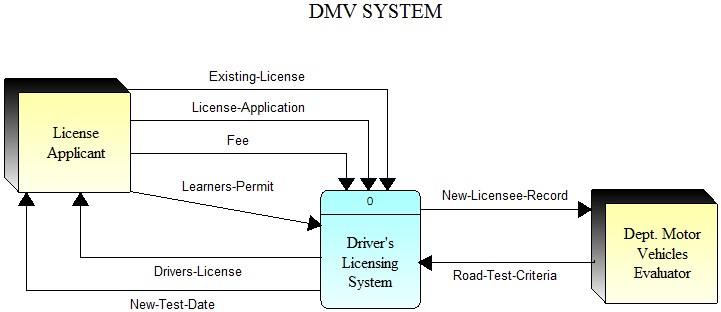 |
eTutorial Brief: How to work with Data Flow Diagrams9:25 MinutesAn overview of Data Flow Diagrams in the Visible Analyst. The videos demonstrates the use of the diagram Nest function, process decomposition, and using the Analyze function to analyze the diagrams. |
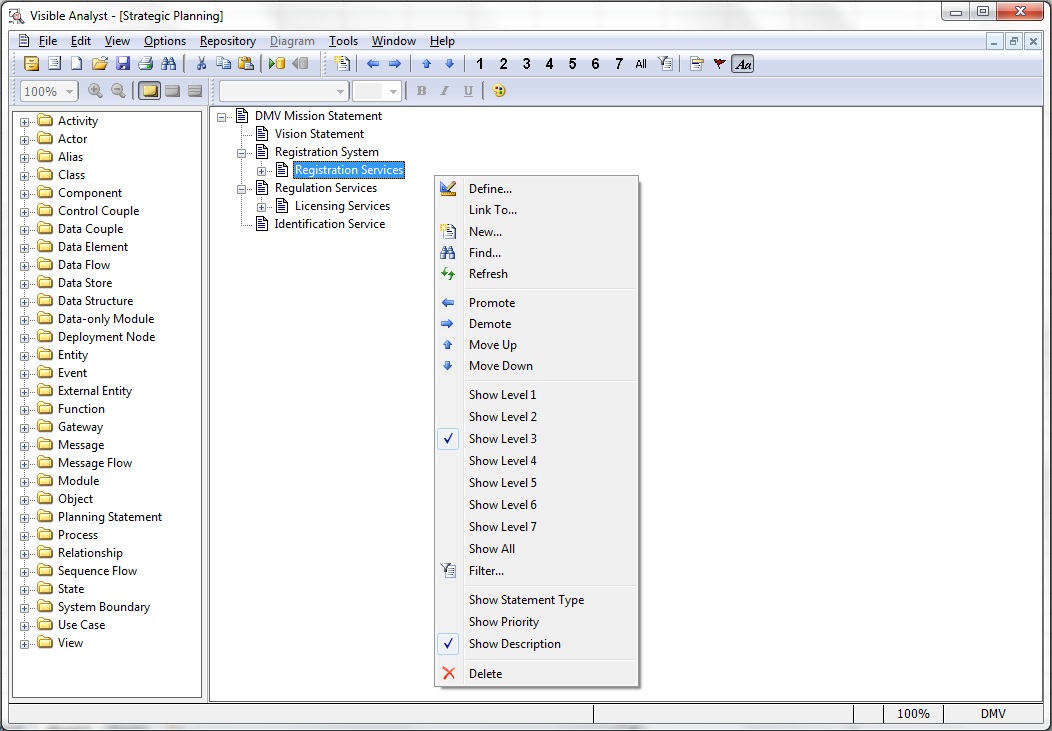 |
eTutorial Brief: How to work with Visible Analyst Business Rule Planning Statements4:05 MinutesAn overview of how business rules are developed in the Visible Analyst as Stategic Planning Statements and linked to the supporting repository objects. |
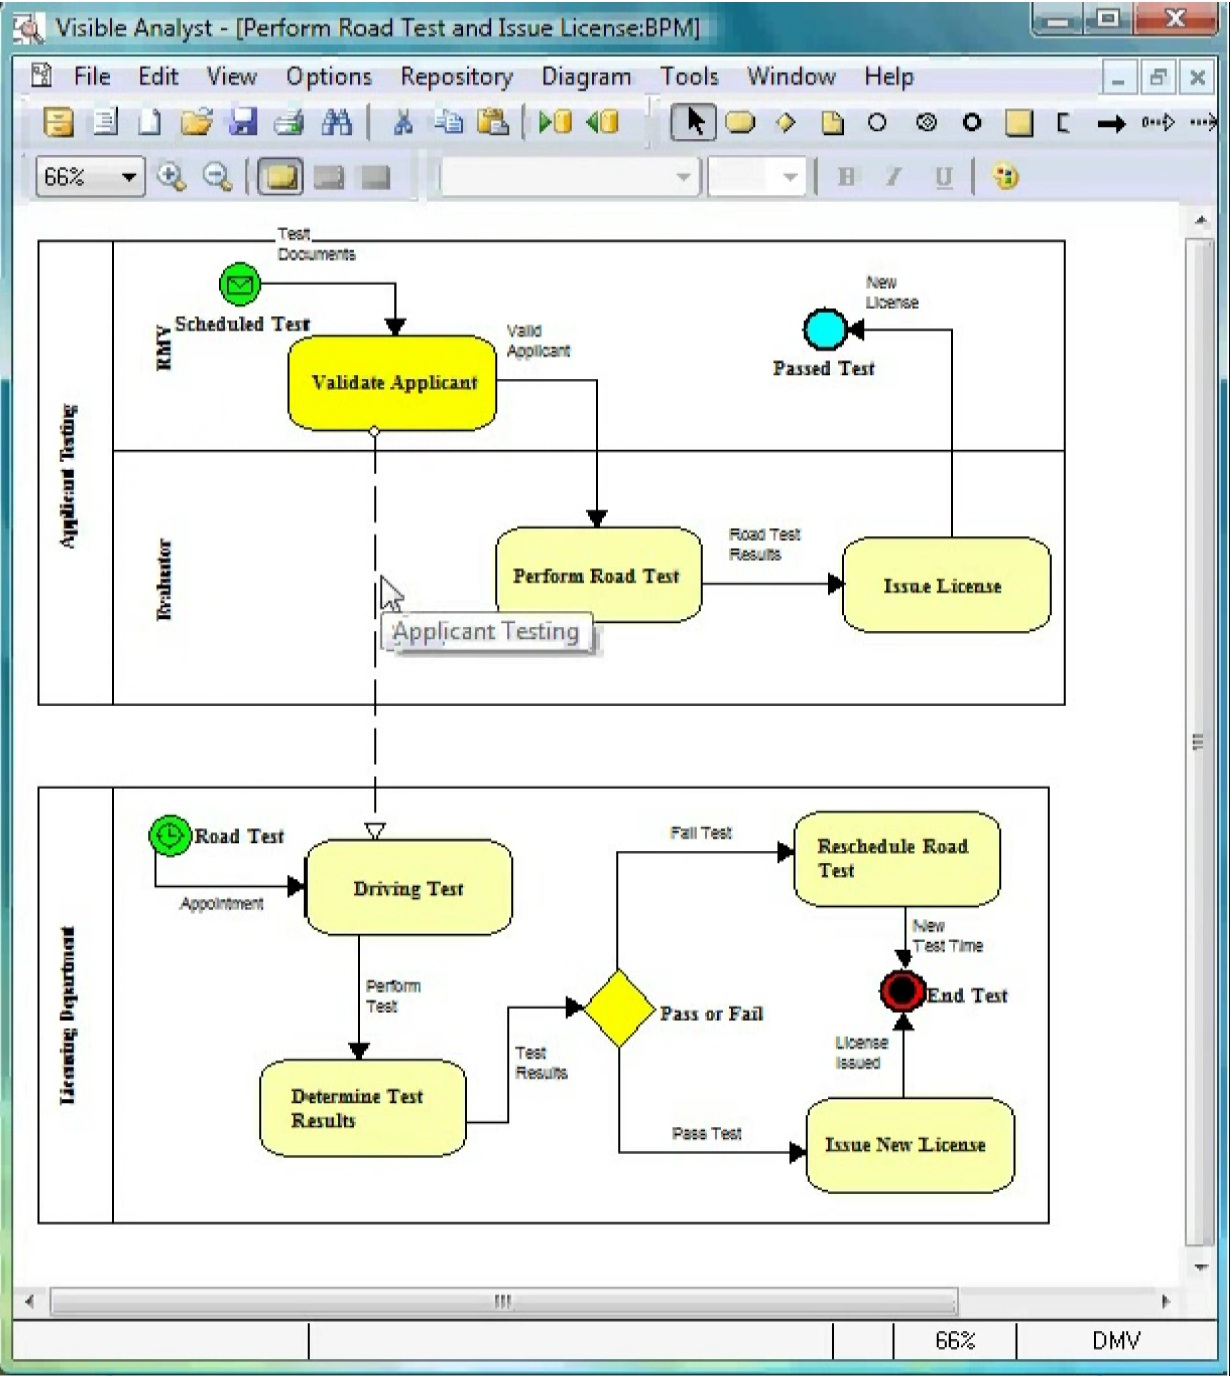 |
eTutorial Brief: How to work with the Visible Analyst Business Process Management (BPMN) Models5:01 MinutesThis video segment provides an overview of business process modeling in the Visible Analyst. |
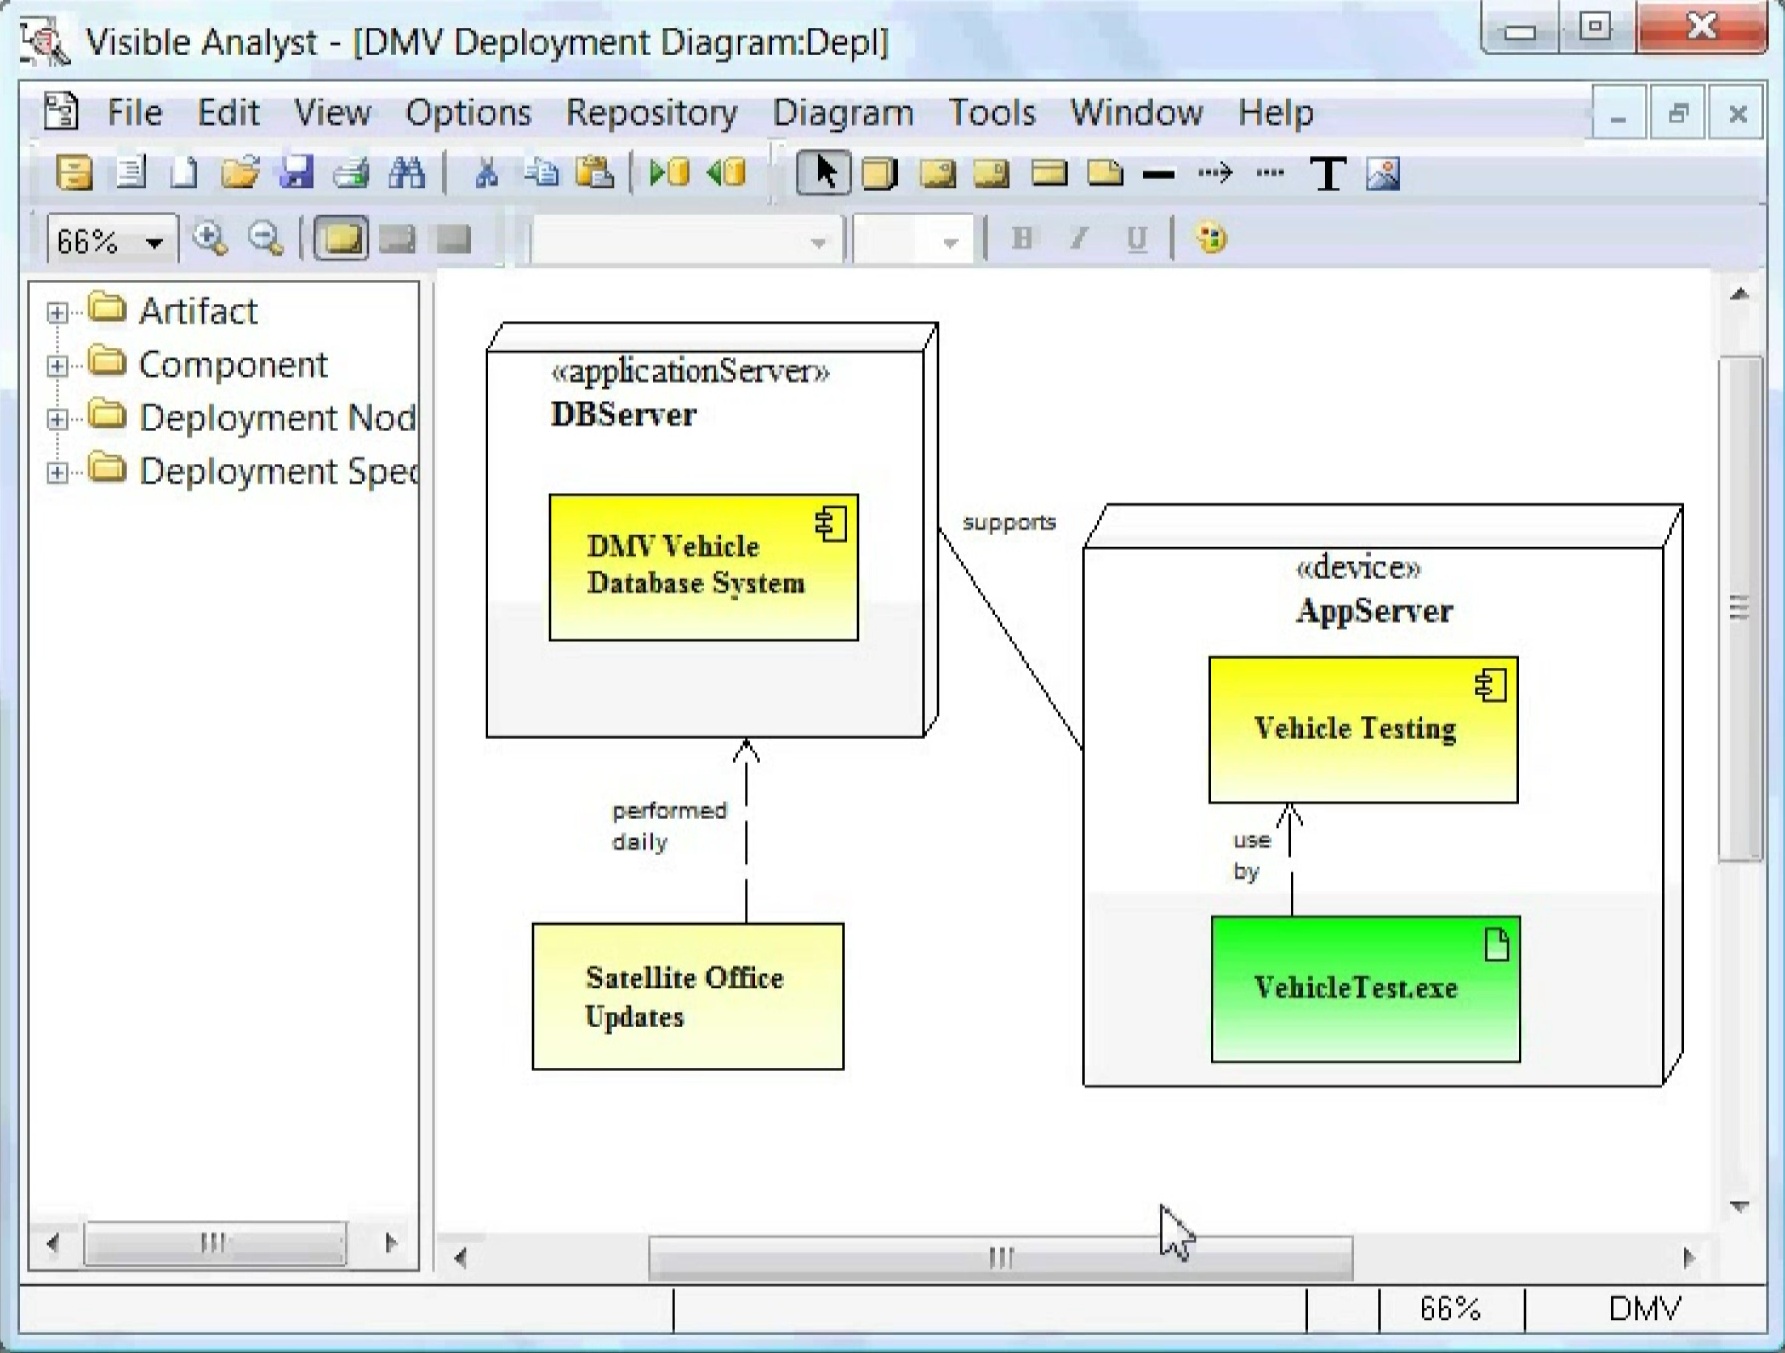 |
eTutorial Brief: How to work with Visible Analyst Deployment Object Models3:15 MinutesDeveloping and using Deployment diagrams in the Visible Analyst. |
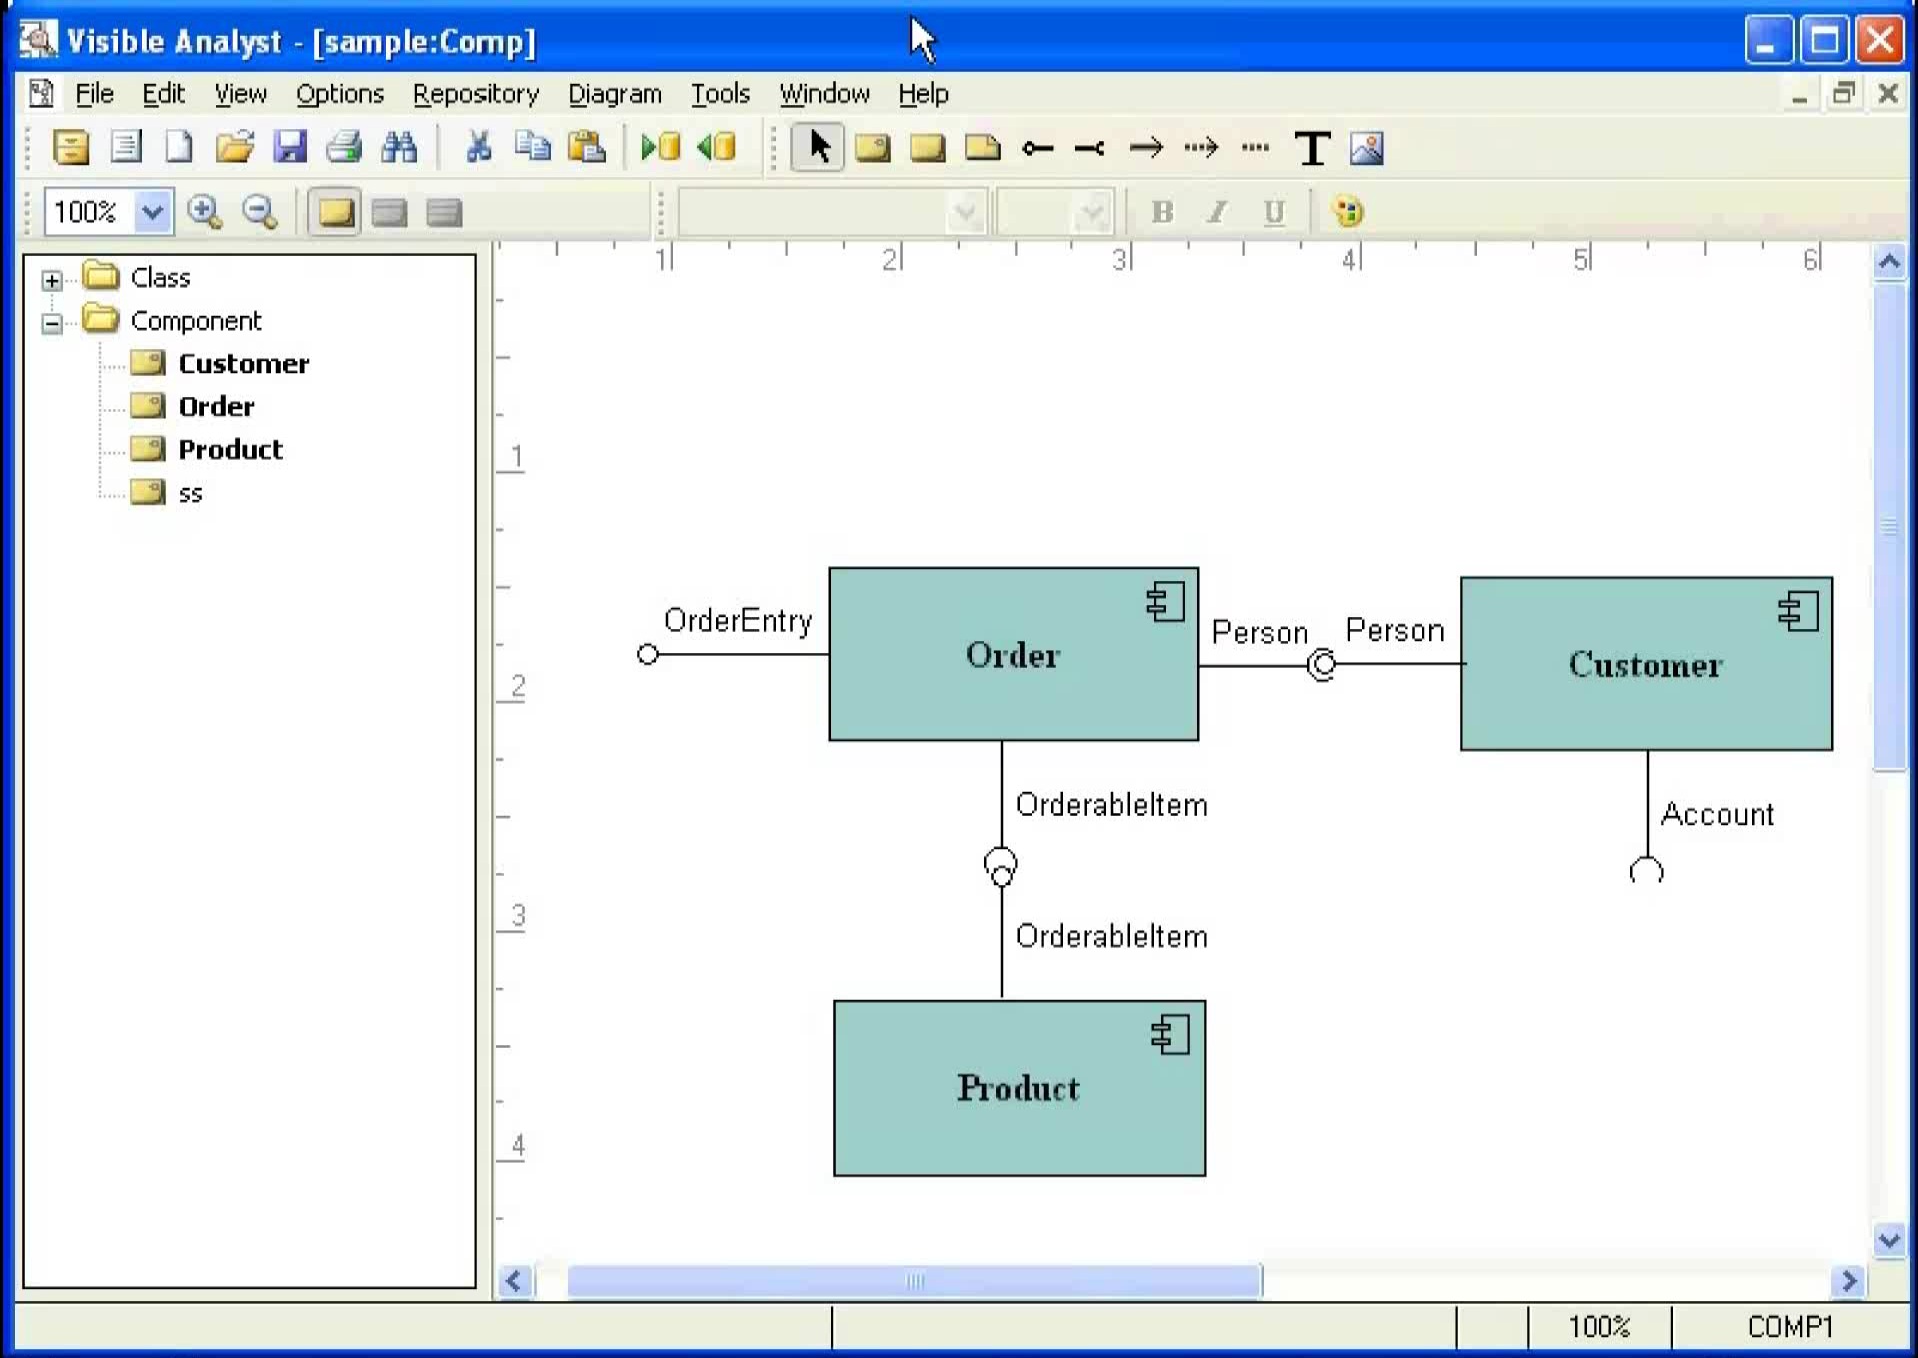 |
eTutorial Brief: How to work with Visible Analyst Component Object Models2:36 MinutesDemonstration of how to draw and use Component diagrams in the Visible Analyst. |
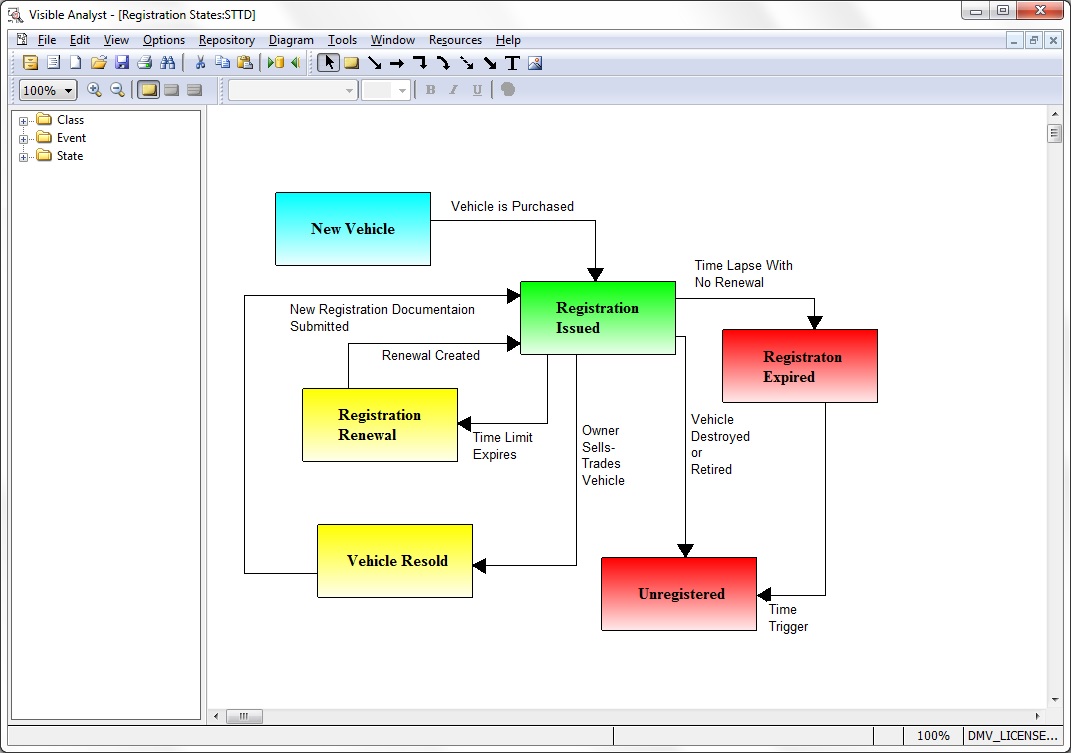 |
eTutorial Brief: How to work with Visible Analyst State Transition Diagrams8:33 MinutesDemonstration of how to draw and use State Transition diagrams in the Visible Analyst. |
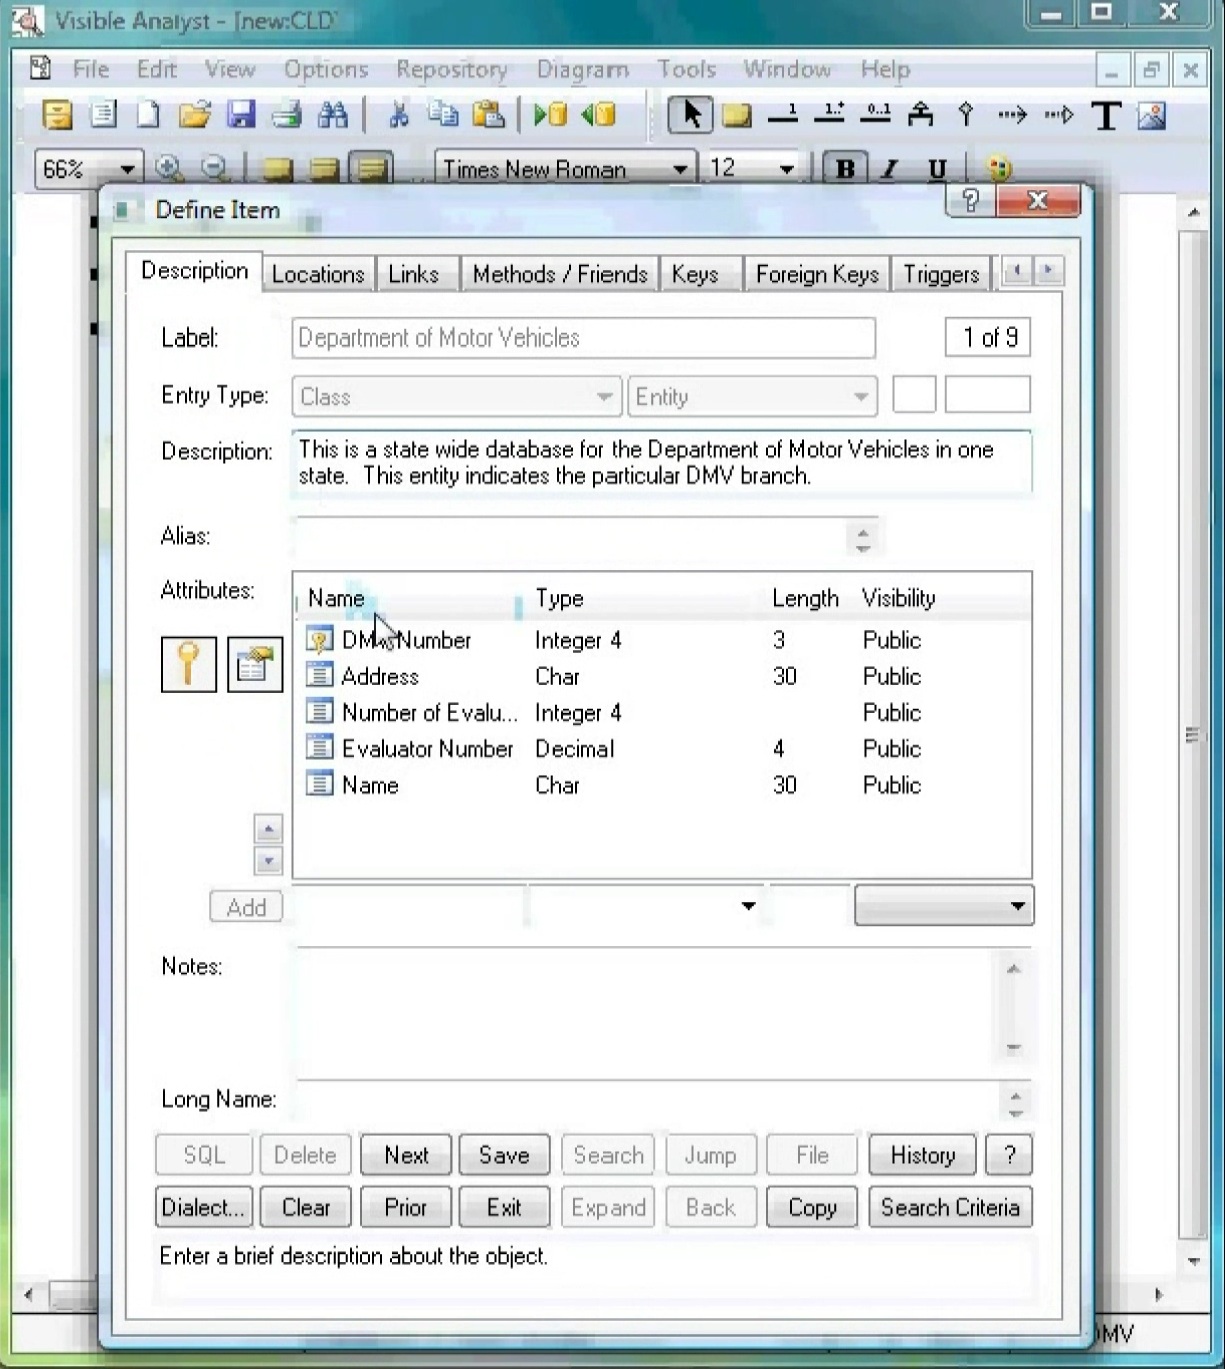 |
eTutorial Brief: How to work with the Visible Analyst Data-to-Class Object Model Transition4:38 MinutesData models are demonstrated and their transition to various Class and Object models in the Visible Analyst. |
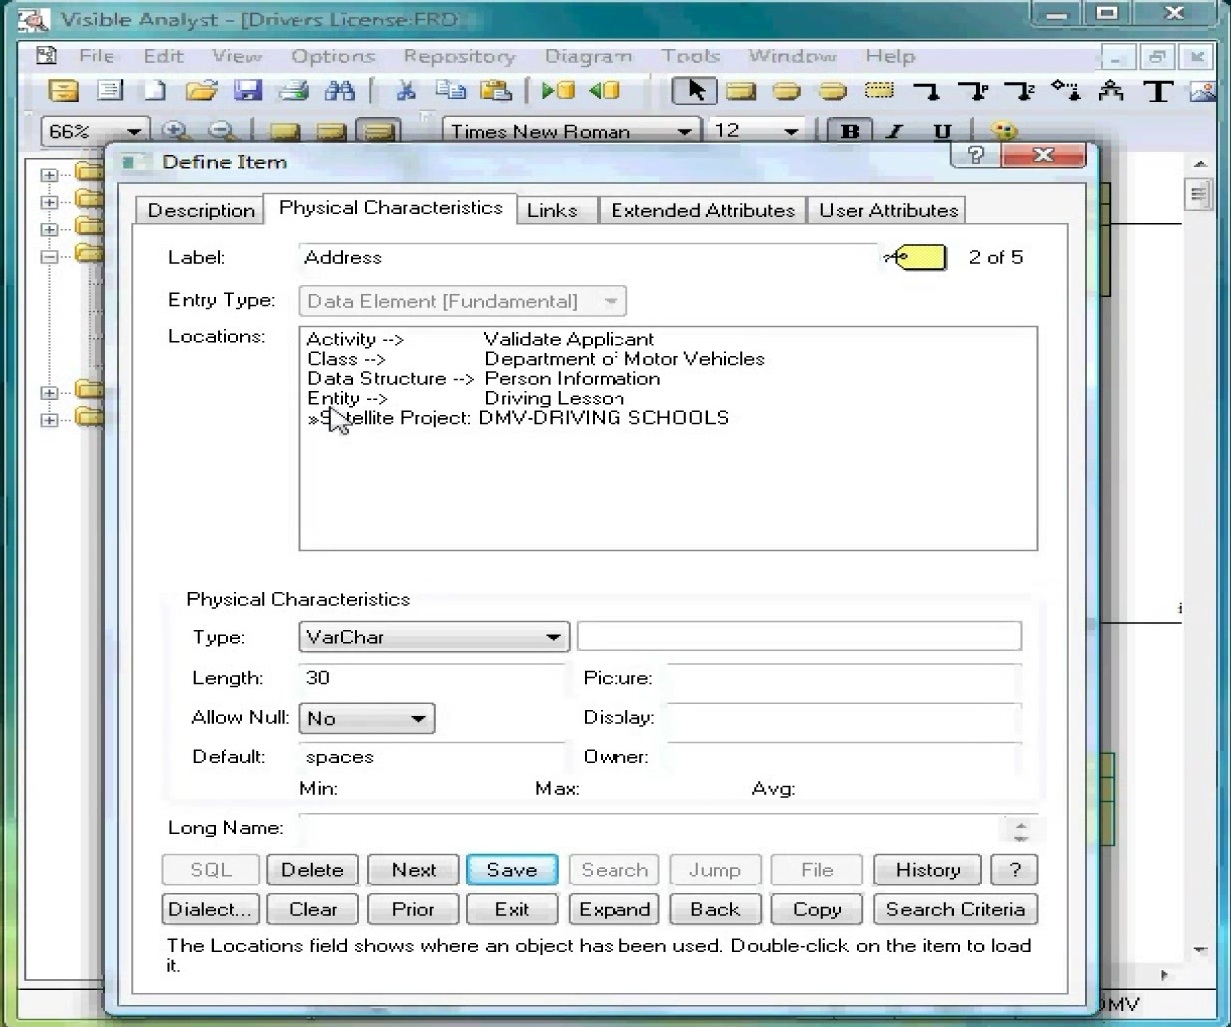 |
eTutorial Brief: How to Implement the Visible Analyst Repository Integration5:17 MinutesExamples of the repository integration available in the Visible Analyst. |
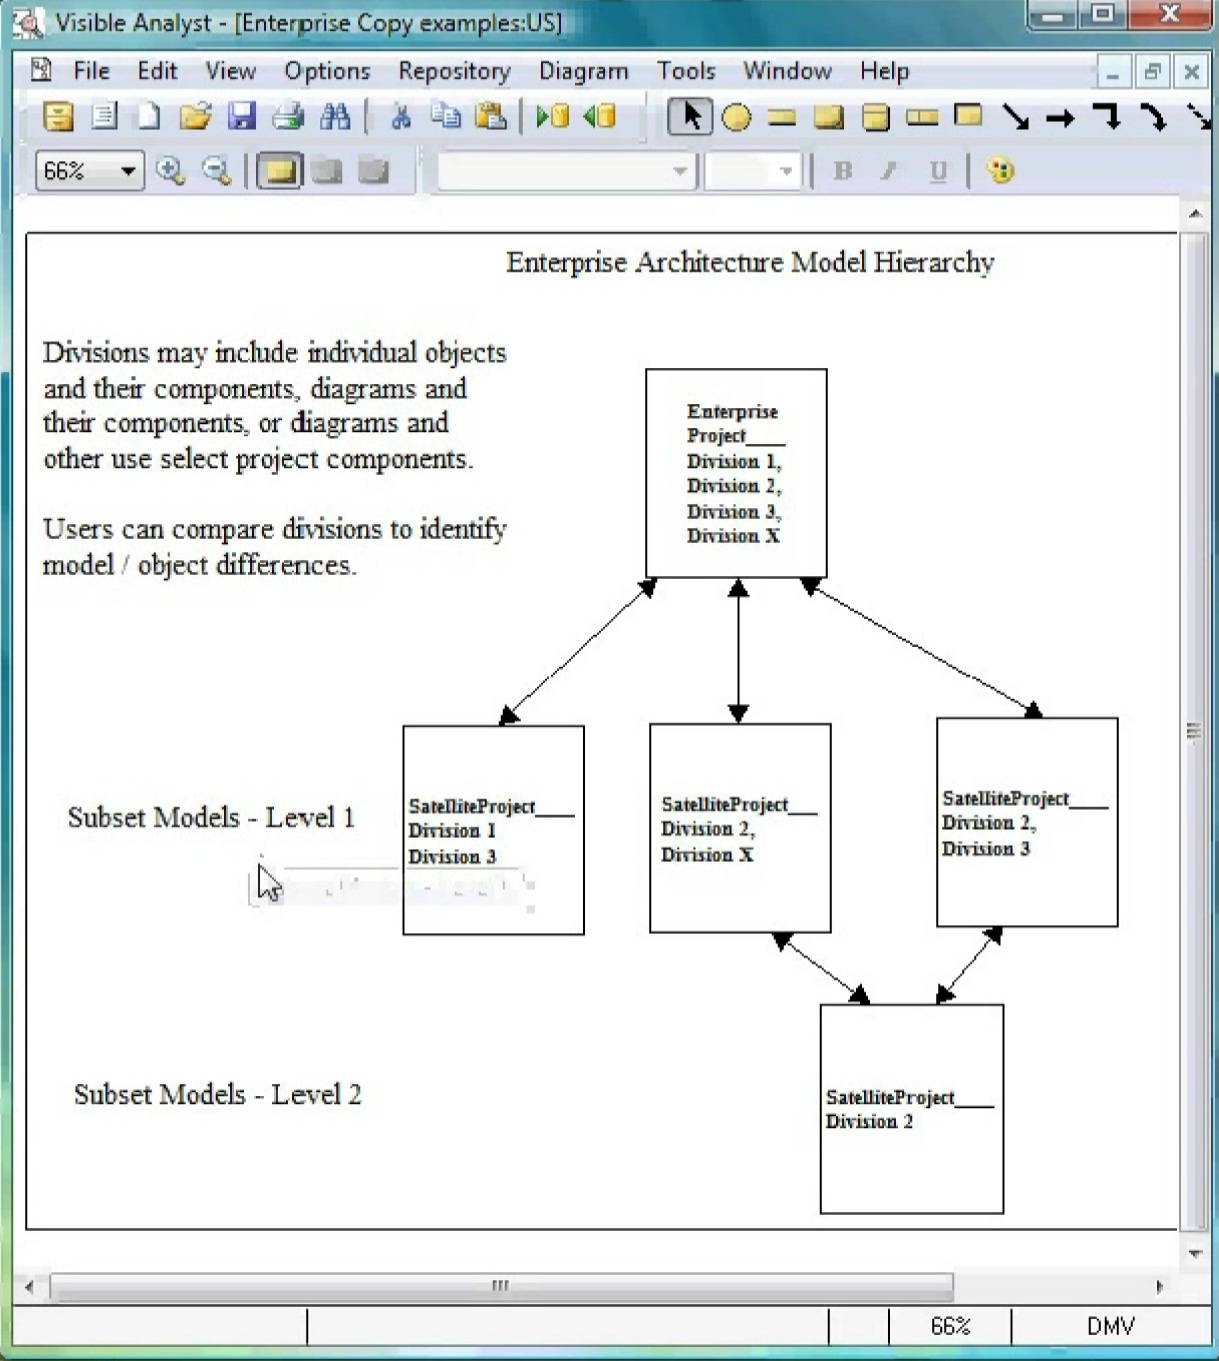 |
eTutorial Brief: How to work with the Visible Analyst Model Management Capability4:35 MinutesThe model management capabilities of the Visible Analyst using Enterprise Copy. This feature is unavailable in the University and single user Visible Analyst Student Edition. |
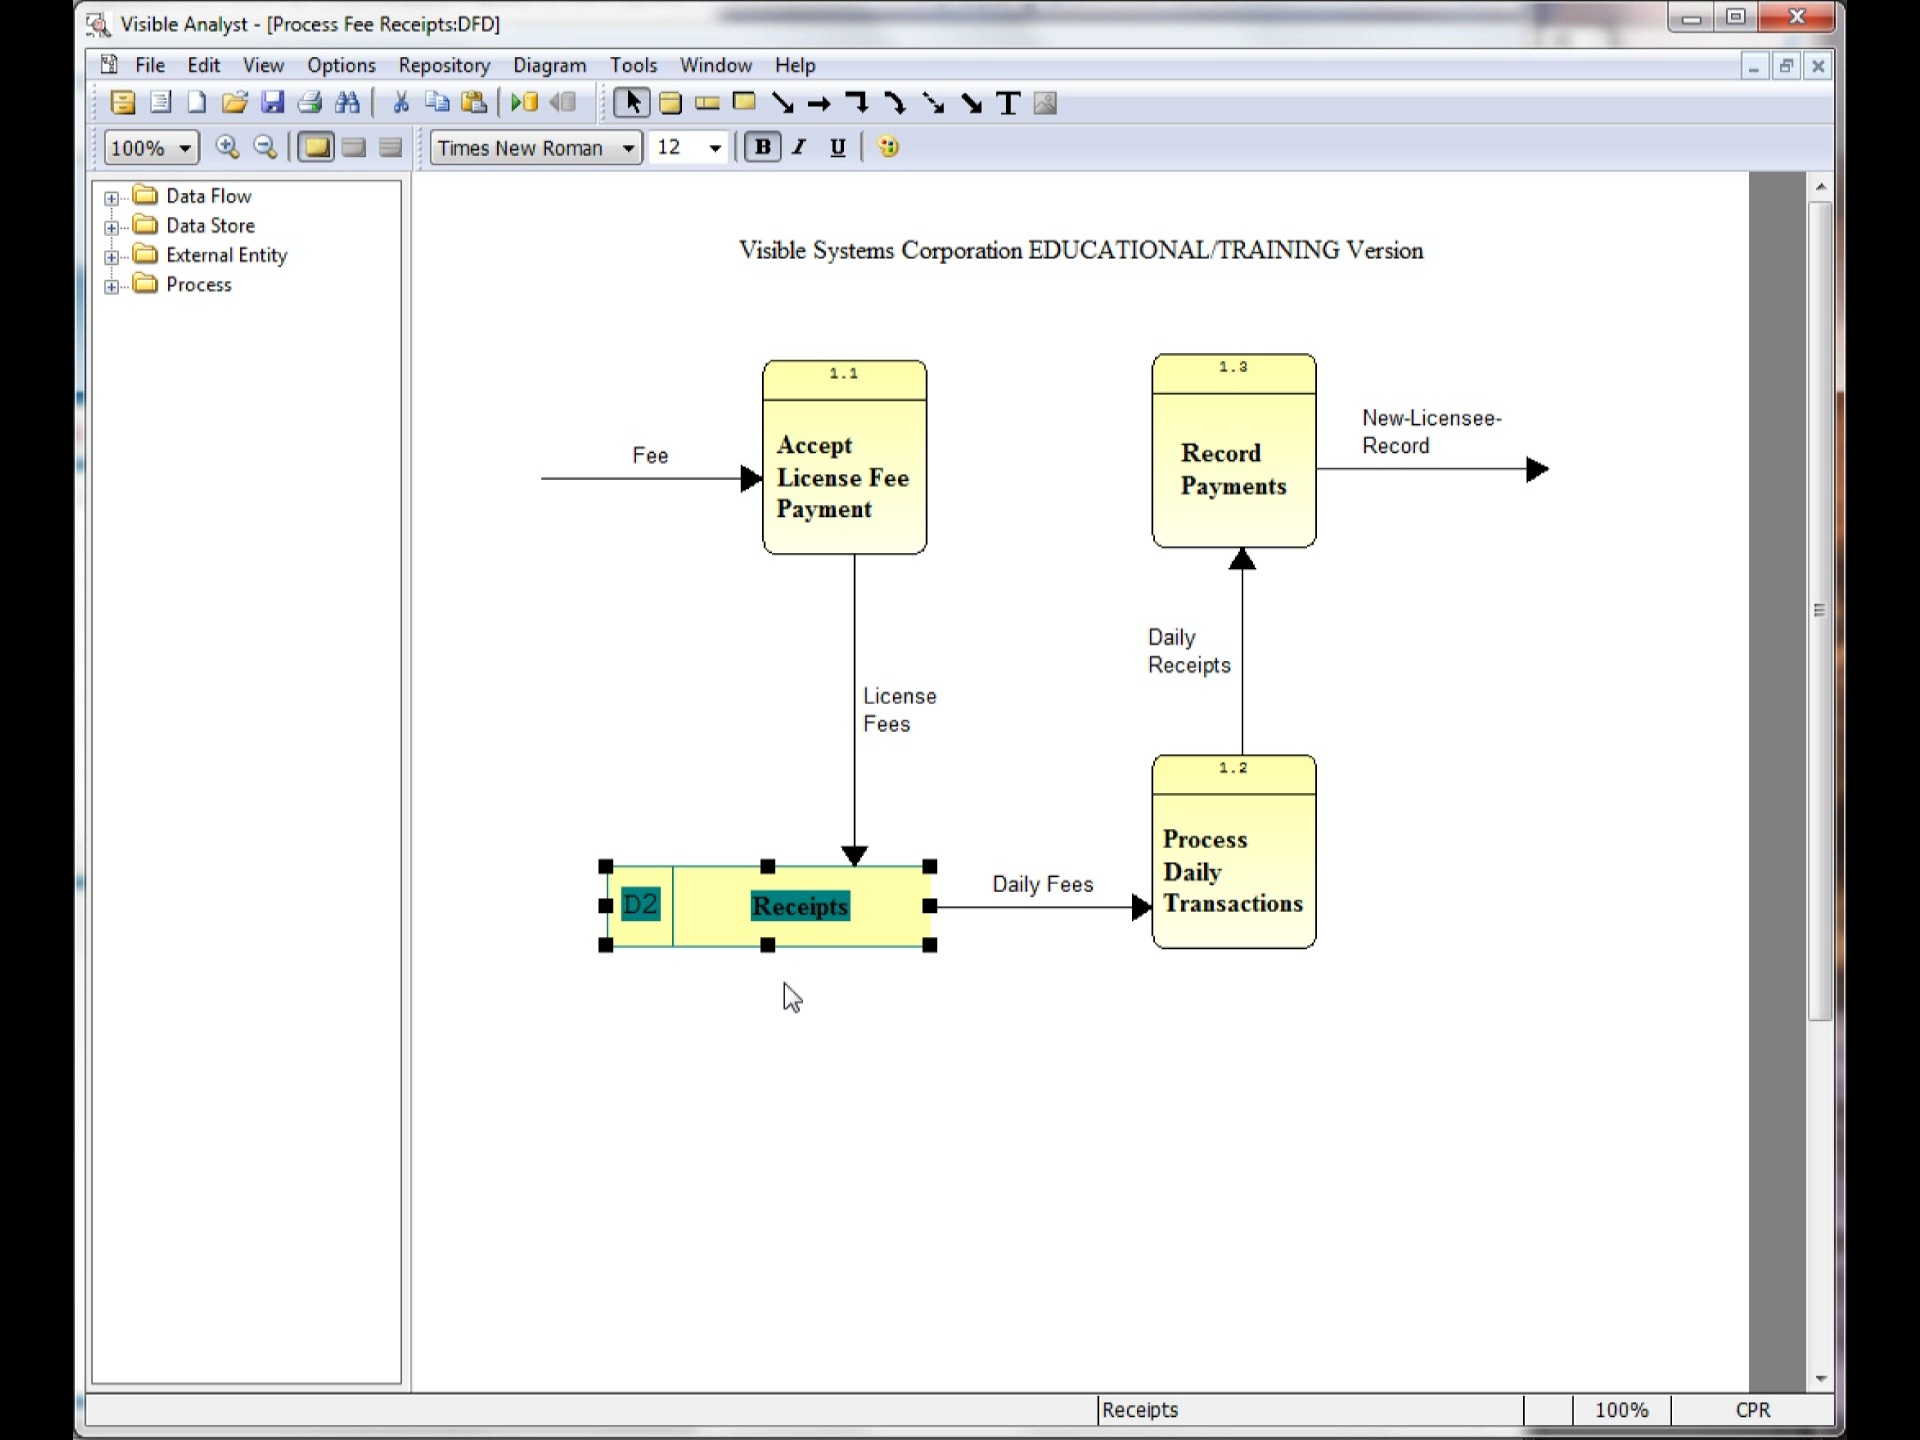 |
eTutorial Brief: How to work with Data Stores4:02 MinutesExplains at which level of the DFD you should add a data store and some of the rules when using data stores on a data flow diagram. |
 |
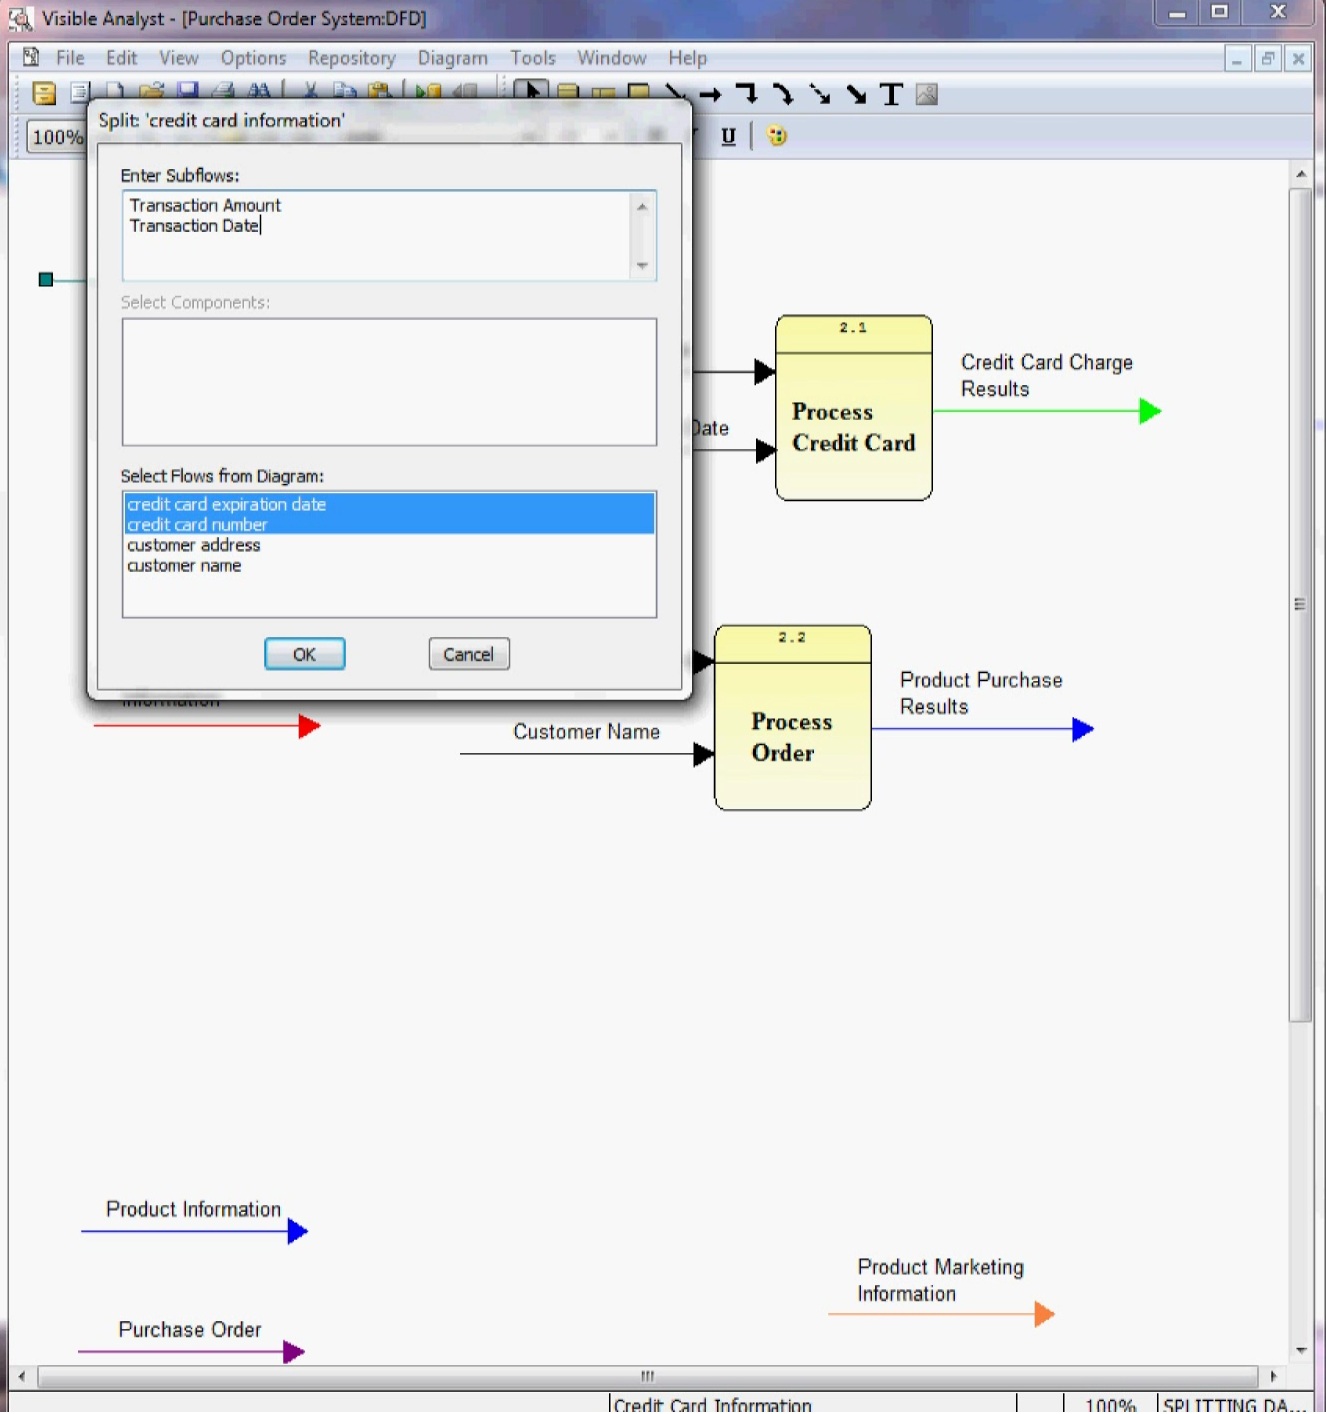
eTutorial Brief: How to split Data Flows5:25 MinutesUse of the Split Dataflow function is explained and demonstrated. The review includes the use of using complex data flows on the higher level diagrams, and then using Split Dataflow to show the component flows on the lower level diagrams. The "Too many flows to fit on diagram..." message is explained and resolved. |
 |
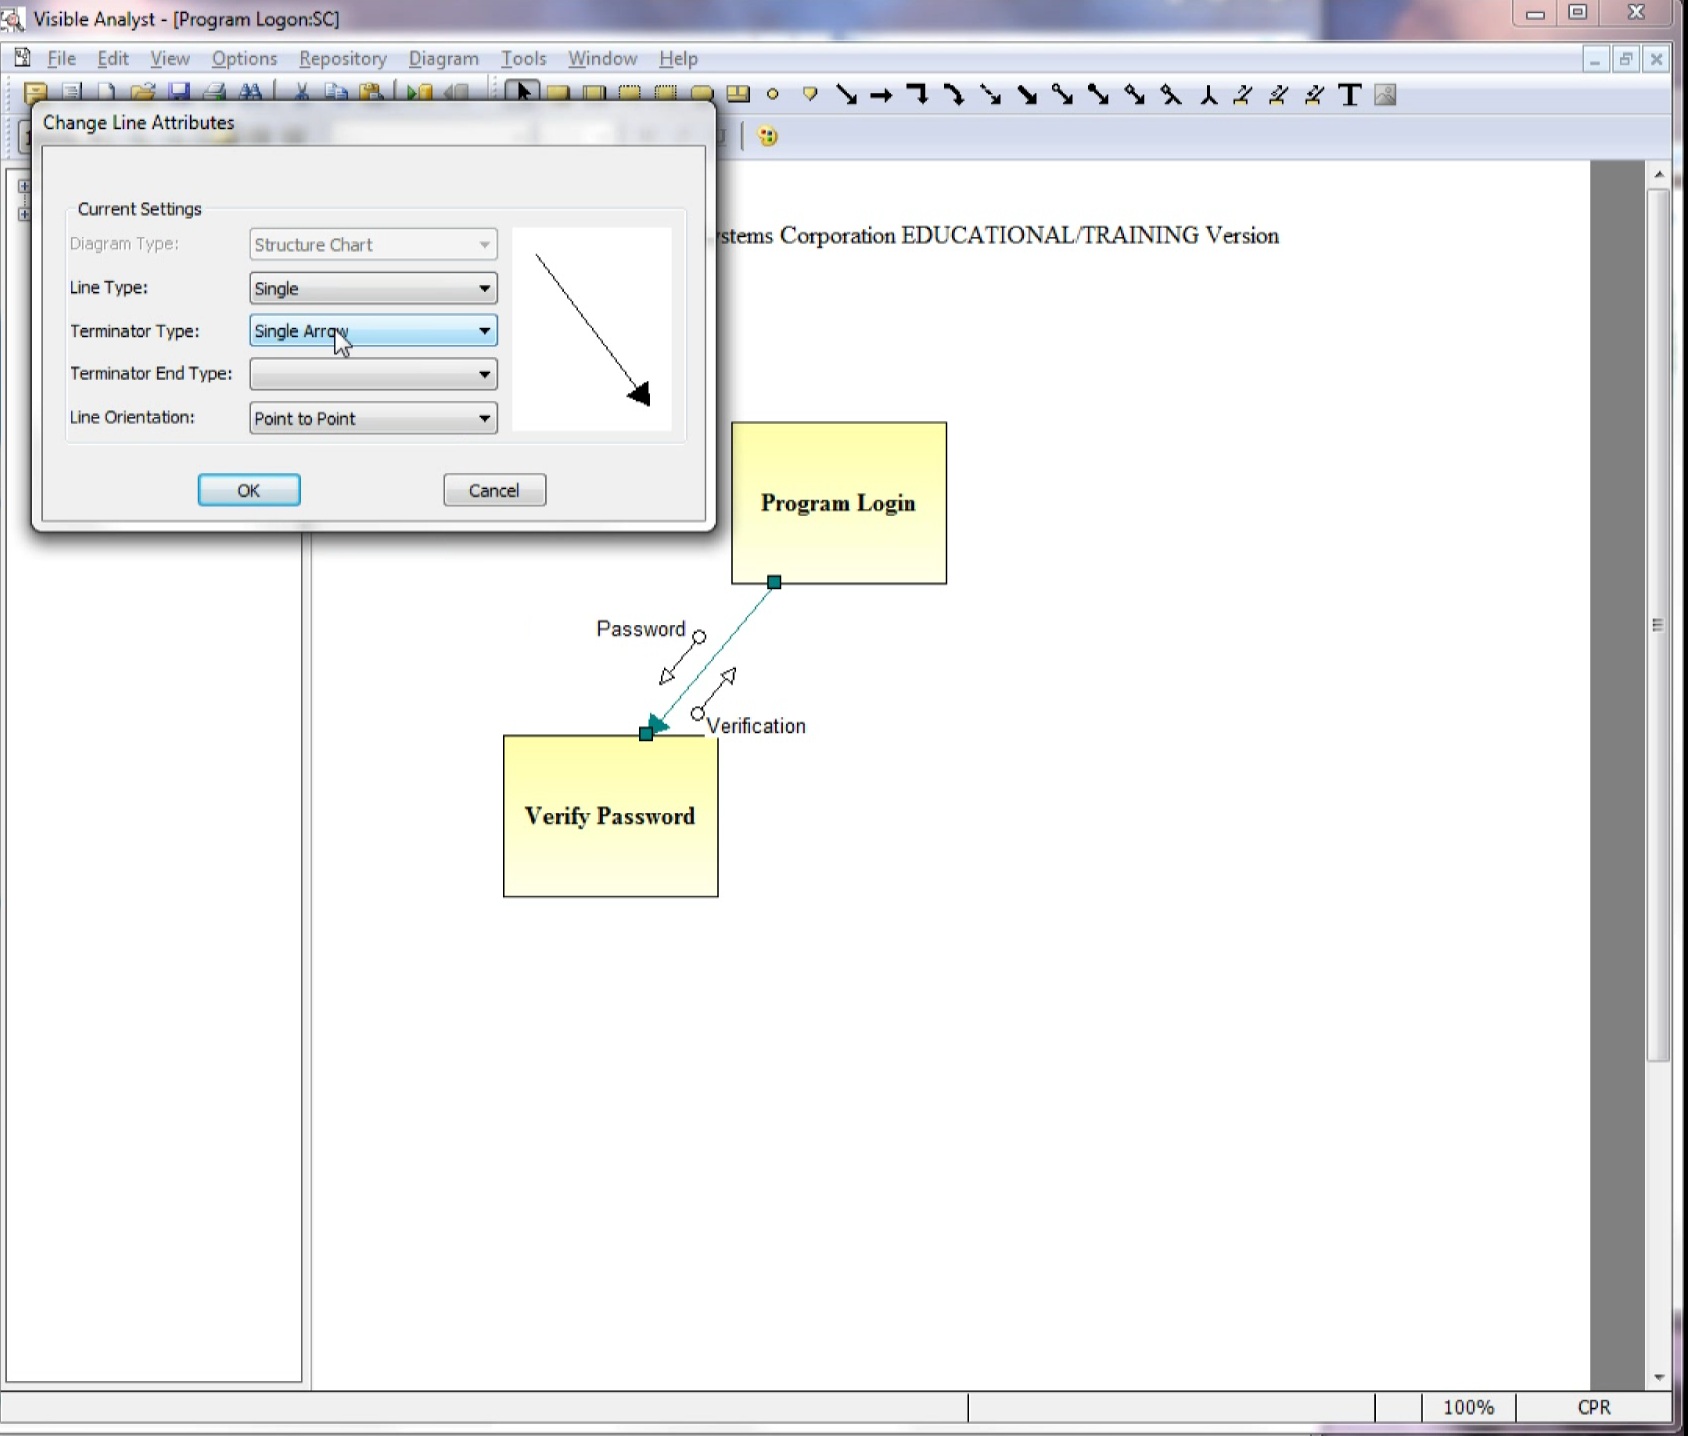
eTutorial Brief: How to work with Lines in the Visible Analyst9:17 MinutesA review of working with lines in the Visible Analyst, including adding lines; changing the line orientation; adding line segments; automaticly drawing lines; the line options available on the Options menu. |
|
eTutorial Brief: Using the Instructor Assignment feature in the Visible Analyst9:52 MinutesThis briefing describes the Instructor assignment feature of the Visible Analyst. It demonstrates the registration process, creation of assignments, students accessing the assignment and submitting the completed assignment. It concludes with the instructor grading the assignment and the student reviewing the grades and instructor comments. |
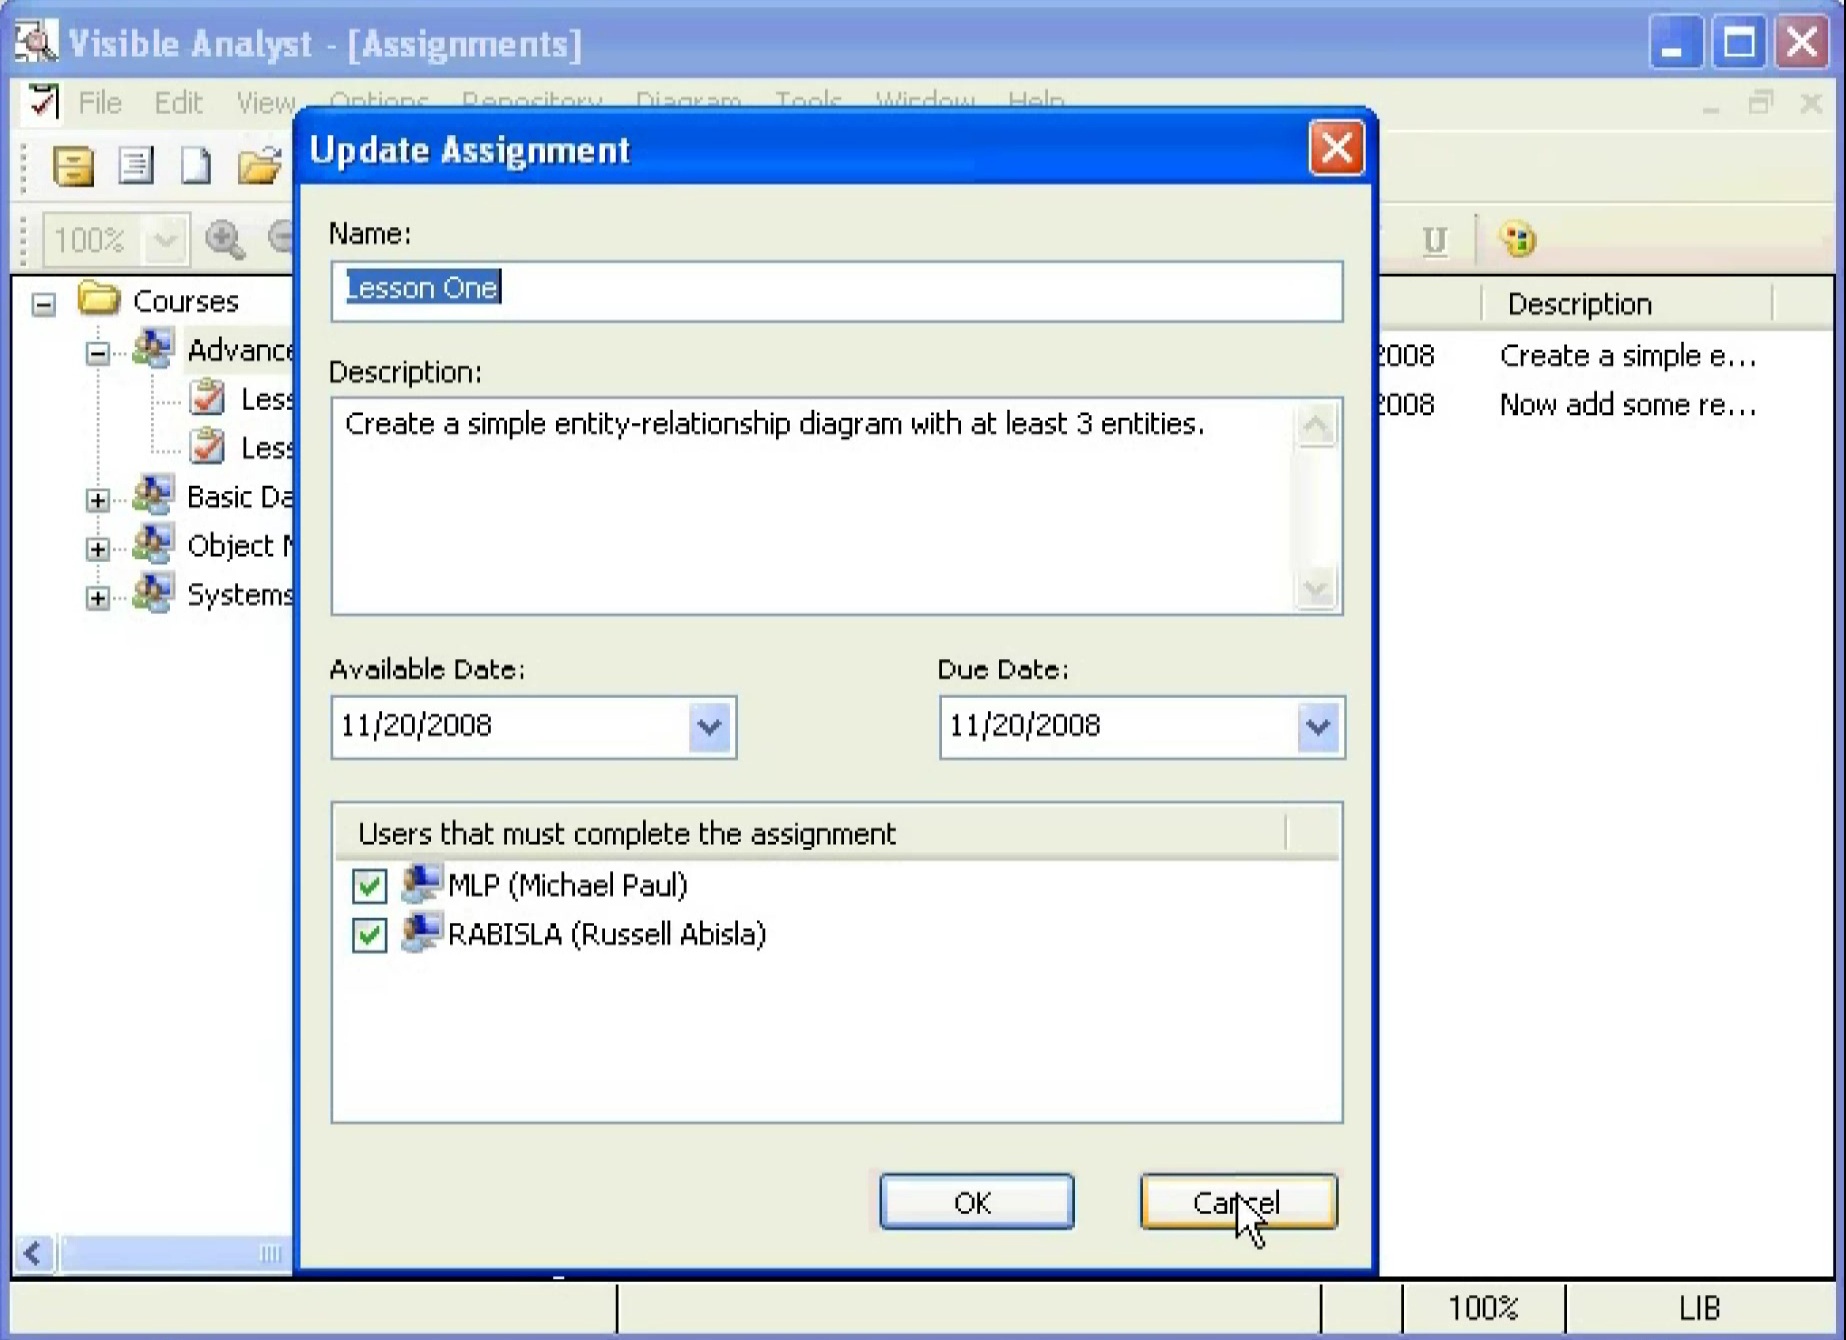 |
eTutorial Brief: How to use the Visible Analyst University Assignment Feature6:38 MinutesThis briefing describes the instructor assignment feature of the Visible Analyst University Edition. It demonstrates the creation of assignments and how these assignments are worked on by the student and then subsequently reviewed and graded by the instructor. |
|
eTutorial Brief: How to work with Functional Decomposition Diagrams5:35 MinutesAn overview of Functional Decomposition Diagrams in the Visible Analyst. The videos demonstrates the use of Change Item, Coloring Symbols, Snap Symbols, Auto-connect to connect symbols, Analyze, and using Spawn to generate a Data Flow Diagram set. |